


 Pro Content
Columbia Sportswear Company Publish Q1’23 Financial Results & Updated Full Year Outlook
Columbia Sportswear reports first Quarter 2023 financial results and updates full year 2023 financial outlook.
First Quarter 2023 Highlights
Net sales increased 8 percent to $820.6 million, compared to first quarter 2022. Operating income decreased 33 percent to $56.4 million, or 6.9 percent of net sales, compared to first quarter 2022 operating income of $83.7 million, or 11.0 percent of net sales. Exited the quarter with $461.0 million of cash and short-term investments and no borrowings.
Full Year 2023 Financial Outlook
Net sales of $3.57 to $3.67 billion (unchanged) representing net sales growth of 3 to 6 percent (unchanged) compared to 2022. Operating income of $413 to $431 million (prior $413 to $448 million), representing operating margin of 11.6 to 11.8 percent (prior 11.6 to 12.2 percent).
Chairman, President and Chief Executive Officer Tim Boyle commented, “First quarter results highlight the importance and value of our diversified global business model. We were able to generate healthy net sales growth, up 8 percent year-over-year, as consumer demand remained strong in many areas of our business. After three years of pandemic related supply chain constraints, it’s gratifying to see that our wholesale on-time delivery rates have returned to pre-pandemic service levels. As we look towards the summer, Columbia’s differentiated portfolio of sun protection and cooling technologies has never been stronger, including our latest innovation, Omni-Shade Broad Spectrum. We are also makng targeted marketing investments across footwear and apparel, including our largest PFG campaign to date, Protect What You Love. “
“2023 is off to a solid start and we are reiterating our full year net sales outlook, while narrowing our diluted EPS range. We are executing on our plan to reduce inventory levels, while focusing on profitability.
“In periods of economic uncertainty, our strong financial position is a strategic advantage. We exited the first quarter with over $460 million in cash and short-term investments, and no bank borrowings. I am confident we have the right strategies in place to drive profitable growth, and we are committed to investing in our strategic priorities to: accelerate profitable growth; create iconic products that are differen-tiated, functional and innovative; drive brand engagement through increased, focused demand creation investments; enhance consumer experiences by investing in capabili-ties to delight and retain consumers; amplify marketplace excellence, with digitally-led, omni-channel, global distribution; and empower talent that is driven by our core values.”
First Quarter 2023 Financial Results
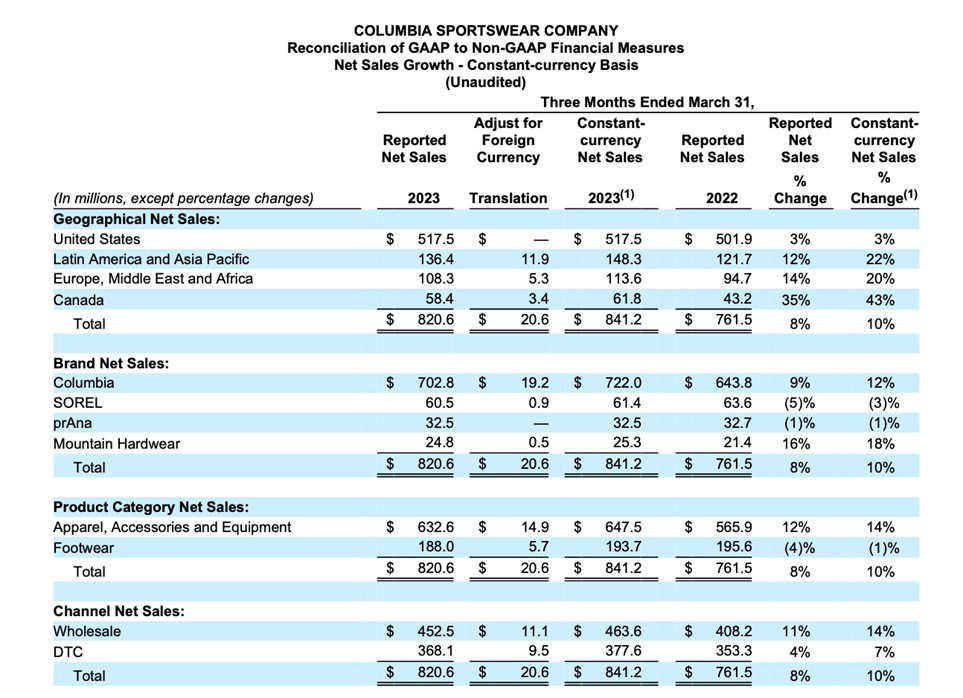
Net sales increased 8 percent (10 percent constant-currency) to $820.6 million from $761.5 million for the comparable period in 2022. The increase in net sales primarily reflects earlier shipment of Spring 2023 wholesale orders and direct-to-consumer (DTC) growth.
Gross margin contracted 100 basis points to 48.7 percent of net sales from 49.7 percent of net sales for the comparable period in 2022. The primary driver of gross margin contrac-tion was increased promotional activity, compared to exceptionally low promotions in first quarter 2022, partially offset by favorable inbound ocean freight costs.
SG&A expenses increased 16 percent to $347.4 million, or 42.3 percent of net sales, from $299.1 million, or 39.3 percent of net sales, for the comparable period in 2022. SG&A expense growth primarily reflected higher supply chain costs related to elevated inventory levels and third-party logistics transition costs, higher DTC expenses to support growth, and investments to support our strategies.
Operating income decreased 33 percent to $56.4 million, or 6.9 percent of net sales, compared to operating income of $83.7 million, or 11.0 percent of net sales, for the com-parable period in 2022.
Net income decreased 31 percent to $46.2 million, or $0.74 per diluted share, compared to net income of $66.8 million, or $1.03 per diluted share, for the comparable period in 2022.
Balance Sheet as of March 31, 2023
Cash, cash equivalents and short-term investments totaled $460.6 million, compared to $610.3 million as of March 31, 2022. The Company had no borrowings as of March 31, 2023 or 2022.
Inventories increased 34 percent to $959.2 million, compared to $714.4 million as of March 31, 2022. Elevated carryover inventory, earlier receipt of current season inventory, and to a lesser extent, increased older season inventory resulted in higher inventory levels. Older season inventories represent a manageable portion of our total inventory mix.
Cash Flow for the Three Months Ended March 31, 2023
Net cash provided by operating activities was $78.0 million, compared to net cash used in operating activities of $33.8 million for the same period in 2022.
Capital expenditures totaled $14.0 million, compared to $12.9 million for the same period in 2022.
Full Year 2023 Financial Outlook
Net sales are expected to increase 3 to 6 percent (unchanged) to $3.57 to $3.67 billion (unchanged) from $3.46 billion in 2022.
Gross margin is expected to expand approximately 60 basis points (unchanged) to ap-proximately 50 percent of net sales (unchanged) from 49.4 percent of net sales in 2022.
SG&A expenses as a percent of net sales, is expected to be 39.0 to 39.2 percent (prior 38.3 to 39.0 percent), compared to SG&A expense as a percent of net sales of 37.7 per-cent in 2022.
The increase in the Company’s SG&A expense outlook is primarily related to incremental distribution and third-party logistics costs being incurred to support elevat-ed inventory levels which are expected to normalize late in 2023.
Operating income is expected to be $413 to $432 million (prior $413 to $448 million), re-sulting in operating margin of 11.6 to 11.8 percent (prior 11.6 to 12.2 percent), compared to operating margin of 11.3 percent in 2022.
Net income is expected to be $322 to $336 million (prior $322 to $347 million), resulting in diluted earnings per share of $5.15 to $5.40 (prior $5.15 to $5.55). This diluted earnings per share range is based on estimated weighted average diluted shares outstanding of 62.4 million (prior 62.5 million).
Balance Sheet and Cash Flows
Operating cash flow is expected to be over $600 million (prior over $500 million).
Capital expenditures are planned to be in the range of $70 to $80 million (prior $70 to $90 million).
First Half 2023 Financial Outlook
Net sales growth of mid-single-digit percent (unchanged), compared to first half 2022. The second quarter is typically the Company’s lowest volume sales quarter and small changes in the timing of product shipments and expenses can have a material impact on reported results.
Inventory growth is anticipated to remain elevated in second quarter, due to expected earlier receipt of Fall ‘23 inventory. The second quarter year-over-year inventory growth rate is anticipated to slow, relative to first quarter inventory growth, before turning to a year-over-year decline starting in third quarter.